
About this lesson
Explore ways to model, interpret, represent and present data.
Year band: 5-6, 7-8
Curriculum Links AssessmentLearning hook
By gathering data on marine turtles, scientists have evidence that helps them work out where turtles migrate and the journeys they take. Scientists can then help to reduce the threats to the turtles’ survival. In this lesson we look at satellite tracking using real scientific data. Explore ways to model, interpret, represent and present data.
This lesson was created and developed in partnership with Pawsey Supercomputing Centre (opens external website in a new window)and Western Australian Marine Science Institution (WAMSI) Kimberley Marine Research Program (opens external website in a new window).Turtle data was sourced from the WAMSI project, which is funded by the Western Australian State Government and research partners. Data is licensed under the Creative Commons BY-NC-SA 2.5 AU licence.
Suggested steps
Step 1
Use a quiz (PDF) (opens in a new window) to stimulate interest in marine turtles and discussion of some key concepts.
Step 2
Use a suitable learning hook to engage students in analysing and interpreting real data about marine turtles. Here are some ideas:
- Where on a map of Australia would you expect to see marine turtles in the wild? Where do they go and what do they do there?
- Use a relevant resource such as Marine turtles in Australia (opens external website in a new window) to show images of different turtle species. Discuss what students know about turtle habitats, conservation status (vulnerable/endangered) and the cultural and social values of turtles for Aboriginal and Torres Strait Islander people. to show images of different turtle species and discuss what students know about their habitat, conservation status (vulnerable/endangered) and cultural and social values of turtles for Aboriginal and Torres Strait Islander people.
- Ask students to hand draw a picture of a turtle thinking about its features and how these features help it survive.
Compare their drawings to an image of a turtle or draw on some inspiration from these 3D models:- Green sea turtle (opens external website in a new window)
- Flatback sea turtle (opens external website in a new window)
- Hawksbill sea turtle (opens external website in a new window)
- Kemps Ridley sea turtle (opens external website in a new window)
- Loggerhead sea turtle (opens external website in a new window)
Step 3
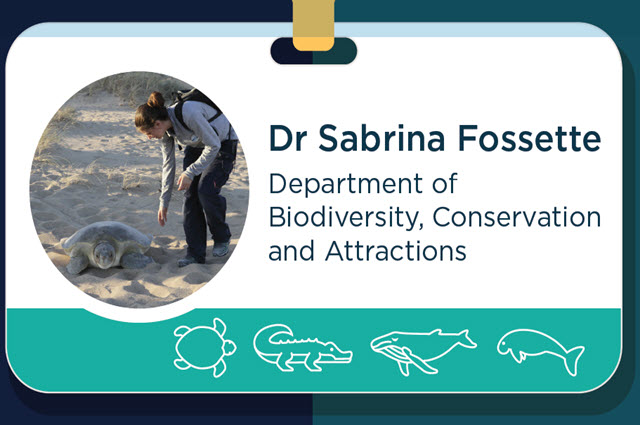
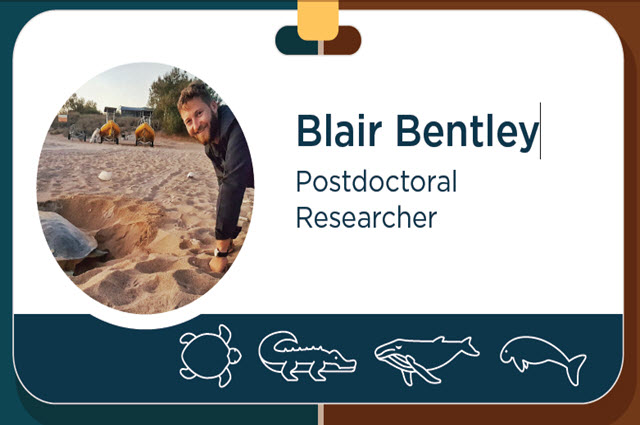
Discuss the work of scientists who work in conservation, surveying populations to ensure relevant data is collected, analysed and used to inform management strategies. Refer to career profiles for Sabrina Fossette (PDF) (opens in a new window) of the Western Australian Department of Biodiversity, Conservation and Attractions and Blair Bentley (PDF) (opens in a new window), a postdoctoral researcher.
Step 4
Discuss satellite tracking (satellite telemetry), a form of data collection used by scientists. Provide FAQs sheet: Satellite Tracking (opens external website in a new window) for more information or teacher background. Sea turtles are migratory animals and the satellite tracking data provides a view of where they go and how long their journeys take. It gives students an opportunity to learn about GPS data (longitude and latitude) and how the two points of longitude and latitude can give us an exact location on Earth.
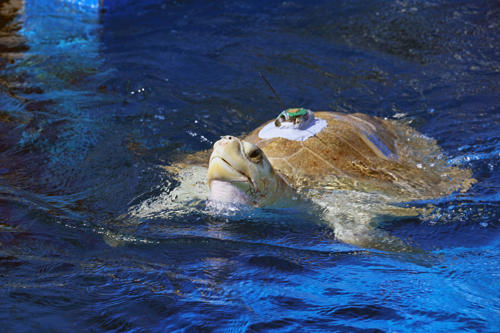
Image credit: USFWS Photo (opens external website in a new window)/Alamy Stock Photo
Step 5
Provide a simplified dataset to plot on a map with longitude and latitude grid references. Use the worksheet Northern Australia map (PDF) (opens in a new window) developed by seaturtle.org. Students can infer a turtle’s direction of travel and indicate this on their map using arrows or other representation. They can also use the grid scale of 500 km to estimate the distance covered. Note that the first five map references from the table will not fit within the map grid references (115–150).
| tag_id | date | latitude | longitude |
|---|---|---|---|
| 76034a | 24/01/2008 19:32 | -22.142 | 113.728 |
| 76034a | 31/01/2008 19:47 | -22.277 | 113.823 |
| 76034a | 6/02/2008 22:09 | -22.3 | 113.757 |
| 76034a | 13/02/2008 2:02 | -22.21 | 112.707 |
| 76034a | 20/02/2008 21:38 | -22.319 | 113.804 |
| 76034a | 27/02/2008 21:17 | -21.128 | 115.137 |
| 76034a | 1/03/2008 14:43 | -20.14 | 115.704 |
| 76034a | 27/03/2008 15:10 | -15.314 | 123.166 |
| 76034a | 3/04/2008 5:52 | -14.175 | 124.57 |
| 76034a | 10/04/2008 6:22 | -12.642 | 126.599 |
| 76034a | 17/04/2008 18:02 | -11.438 | 128.559 |
| 76034a | 25/04/2008 22:56 | -10.982 | 130.781 |
| 76034a | 3/05/2008 5:42 | -10.86 | 132.771 |
| 76034a | 10/05/2008 18:28 | -10.374 | 134.917 |
| 76034a | 14/05/2008 15:02 | -10.197 | 136.583 |
| 76034a | 25/05/2008 9:23 | -9.84 | 140.047 |
| 76034a | 1/06/2008 4:01 | -10.434 | 141.259 |
| 76034a | 8/06/2008 15:35 | -10.348 | 141.222 |
| 76034a | 18/06/2008 15:30 | -10.285 | 141.156 |
| 76034a | 24/06/2008 12:50 | -10.309 | 141.434 |
| 76034a | 26/06/2008 15:58 | -10.297 | 141.325 |
Step 6
Compare students’ manually plotted map with the same data, imported as a csv file (opens in a new window), into an online map such as Google My Maps (opens external website in a new window). Do this as a class, on a large screen, as a way to introduce them to the basics of online mapping software. By rolling over each icon, determine the date of the plotting, and infer the direction of a turtle’s journey. Use the onscreen ruler to measure the distance travelled. (The turtle starts at Exmouth in Western Australia and travels along the coast to around Thursday Island in Queensland, taking approximately 6 months a distance of over 3,500km).
Loggerhead turtle satellite tracking data mapped on Google My Maps.
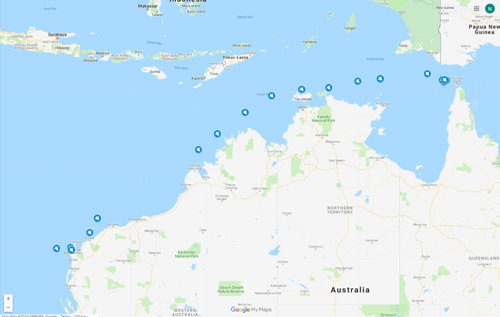
Image credit: Map © Google LLC
Step 7
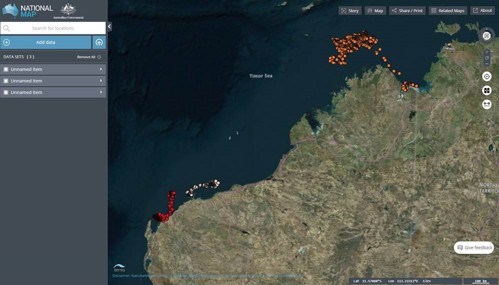
Provide students with four spreadsheets to map using online mapping software such as Google My Maps (opens external website in a new window) (this requires students to have their own Gmail account). Alternative online mapping software include National Map (opens external website in a new window) and Google Earth (opens external website in a new window). National Map is a simple tool to visualise data. Google Earth allows users to render a 3D representation of Earth, viewing data from different angles.
You can import your own data which is ideal for our purpose. All you need is data with columns organised into latitiude and longititude as these are the headings that the mapping software recognises. Data is provided in two formats: csv and kml (opens external website in a new window).
Note that the Ningaloo Loggerhead turtle – Nicki 76034 data displays best in Google My Maps.
- Ningaloo Loggerhead turtle (CSV) (opens in a new window) – Nicki 76034
- Ningaloo Loggerhead turtle (KML) (opens in a new window) – Nicki 76034
- Rosemary Island Hawksbill turtle (CSV) (opens in a new window) – Mayu 152612
- Rosemary Island Hawksbill turtle (KML) (opens in a new window) – Mayu 152612
- Cape Domett flatback turtle (CSV) (opens in a new window) – Rena 134552
- Cape Domett flatback turtle (KML) (opens in a new window) – Rena 134552
- Montebellos green turtle (CSV) (opens in a new window) – Miss McCallum 165535
- Montebellos green turtle (KML) (opens in a new window) – Miss McCallum 165535
Step 8
Share students’ analysis of the different species’ migratory data. A scientist’s description has been provided for background with a website link to show how the map should look.
- Ningaloo loggerhead Nicki 76034 (opens external website in a new window) had two silent periods when the tag signals were lost during migration, but transmissions were good before arrival at Torres Strait.
- Rosemary Island hawksbill Mayu 152612 (opens external website in a new window) nested in 2015, foraged, and returned to nest again in 2018.
- Cape Domett flatback Rena 134552 (opens external website in a new window) foraged offshore and was a semi-nomadic animal during foraging of North Kimberley.
- Montebellos green Miss McCallum 165535 (opens external website in a new window) moved to Muiron Islands and foraged off Pilbara at Onslow.
Step 9
Ask students to do some further research and create an infographic about turtle conservation incorporating the data they used in their online mapping.
Discussion
Digital Technology focus
- How can GPS data and satellite tracking help scientist survey a marine population?
- What is the benefit of using this type of data?
- How did you validate the data? Did any data appear incorrect or an error? How did you know it was an error?
Science focus
- What factors affect the turtle population?
- What do the migrating turtles do at different locations?
HASS focus
- What economic activity may affect a turtle’s migration pattern?
Why is this relevant?
In Digital Technologies, students need to interpret data. To do this it helps to organise the data in some way; for example, in a table under relevant headings. In this spreadsheet, GPS data is provided as longitude and latitude. Students can visualise the data using online mapping software, and can look for patterns or trends. When presenting data to reveal information, students can use these to convey meaning.
This lesson integrates scientific and geographic understanding and skills.
- In science, students use their ICT capability to access information; analyse and represent data; model and interpret concepts and relationships; and communicate science ideas, processes and information.
- In HASS, students develop ICT capability when they locate, select, evaluate, communicate and share geographical information using digital technologies and they learn to use spatial technologies.
Resources
Datasets
- Turtle tracking data (CSV) (opens in a new window)
- Ningaloo Loggerhead turtle (CSV) (opens in a new window) – Nicki 76034
- Ningaloo Loggerhead turtle (KML) (opens in a new window) – Nicki 76034
- Rosemary Island Hawksbill turtle (CSV) (opens in a new window) – Mayu 152612
- Rosemary Island Hawksbill turtle (KML) (opens in a new window) – Mayu 152612
- Cape Domett flatback turtle (CSV) (opens in a new window) – Rena 134552
- Cape Domett flatback turtle (KML) (opens in a new window) – Rena 134552
- Montebellos green turtle (CSV) (opens in a new window) – Miss McCallum 165535
- Montebellos green turtle (KML) (opens in a new window) – Miss McCallum 165535
3D modelling
- 3D model: Green sea turtle (opens external website in a new window)
- 3D model: Flatback sea turtle (opens external website in a new window)
- 3D model: Hawksbill sea turtle (opens external website in a new window)
- 3D model: Kemps Ridley sea turtle (opens external website in a new window)
- 3D model: Loggerhead sea turtle (opens external website in a new window)